Free CLSSBB – Certified Lean Six Sigma Black Belt Practice Test Question

Free demo downloads

Loading demo links...

Showing 4–6 of 15 questions

Question 4

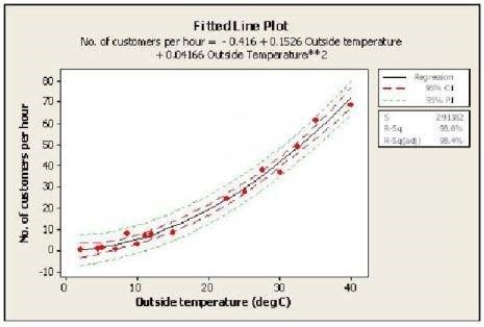
Which statement(s) are correct about the Regression shown here? (Note: There are 2 correct answers).
Select all that apply, then click Submit answer.

  • ○

    The dependent variable is the outside temperature

  • ○

    The relationship between outside temperature and number of customers per hour is a Linear Regression

  • ○

    The dashed lines indicate with 95% confidence where all of the process data should fall between

  • ○

    The dashed lines indicate with 95% confidence the estimate for the Quadratic Regression Line

  • ○

    The predicted number of customers per hour is close to 5 if the outside temperature is 10 deg C
Question 5

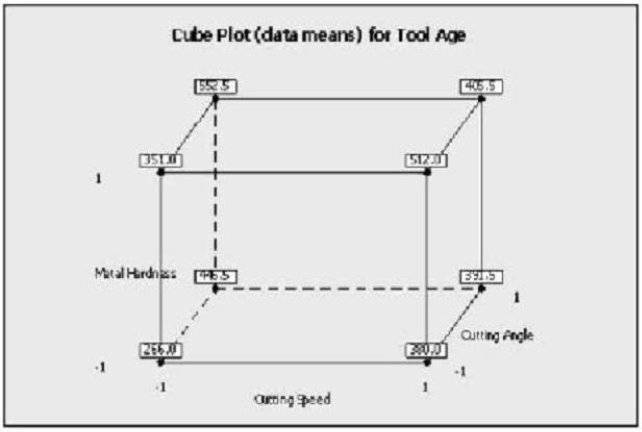
Which statement(s) are correct about the Factorial Plot shown here? (Note: There are 3 correct answers).

Select all that apply, then click Submit answer.

  • ○

    When the cutting speed increased from low to high level, the tool age increases

  • ○

    The coefficient of the metal hardness is positively related to the output of tool age

  • ○

    The coded coefficient is lower for cutting speed than the cutting angle related to the output of tool age

  • ○

    These plots prove a statistically significance factor with 95% confidence

  • ○

    These plots are an example of interaction plots

Question 6

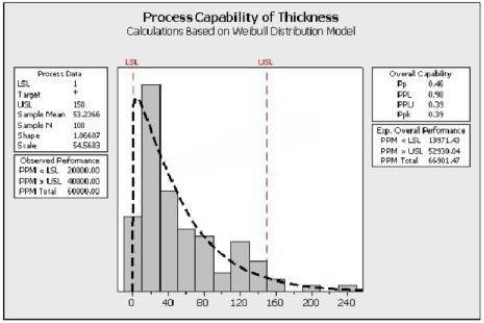
Review the analysis shown there.

Which statements are true about the process? (Note: There are 3 correct answers).

Select all that apply, then click Submit answer.

  • ○

    The initial focus for this project would be to determine why the thicknesses are so frequently too low.

  • ○

    The majority of the process is closer to the lower specification limit.

  • ○

    This process is described with the Weibull Distribution.

  • ○

    The process has more problems with Variation than Centering.

  • ○

    The process follows a non-normal distribution with the given data.